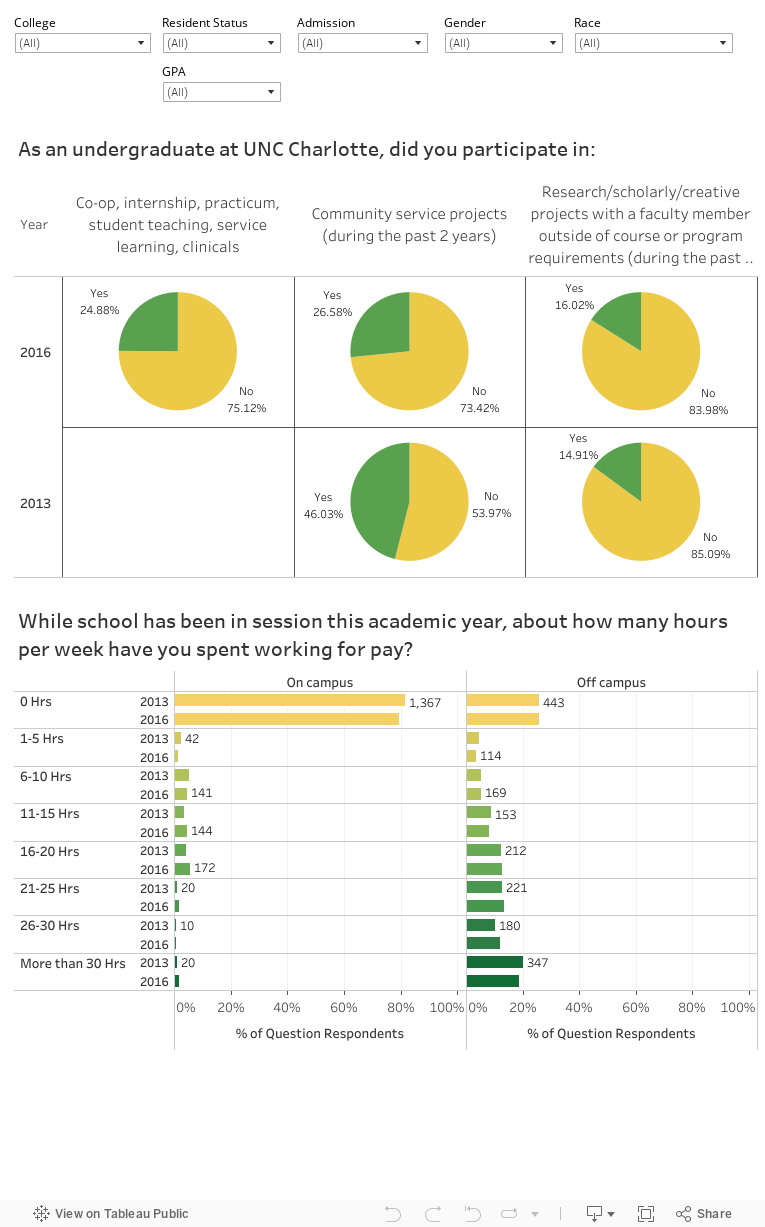
Extracurricular Activities
The pie charts below explore seniors’ participation rates in extracurricular and co-curricular activities, including high-impact engagement practices like participating in faculty-mentored research or in service learning opportunities. The lower bar graph displays information about how many hours students work for pay on or off campus. The bars indicate the percent of students, broken down into hour ranges, while the adjacent numbers indicate the raw count of respondents. For all graphs, use the dropdown menus to further refine the data shown.
Return to main Senior Survey page.