IT Services
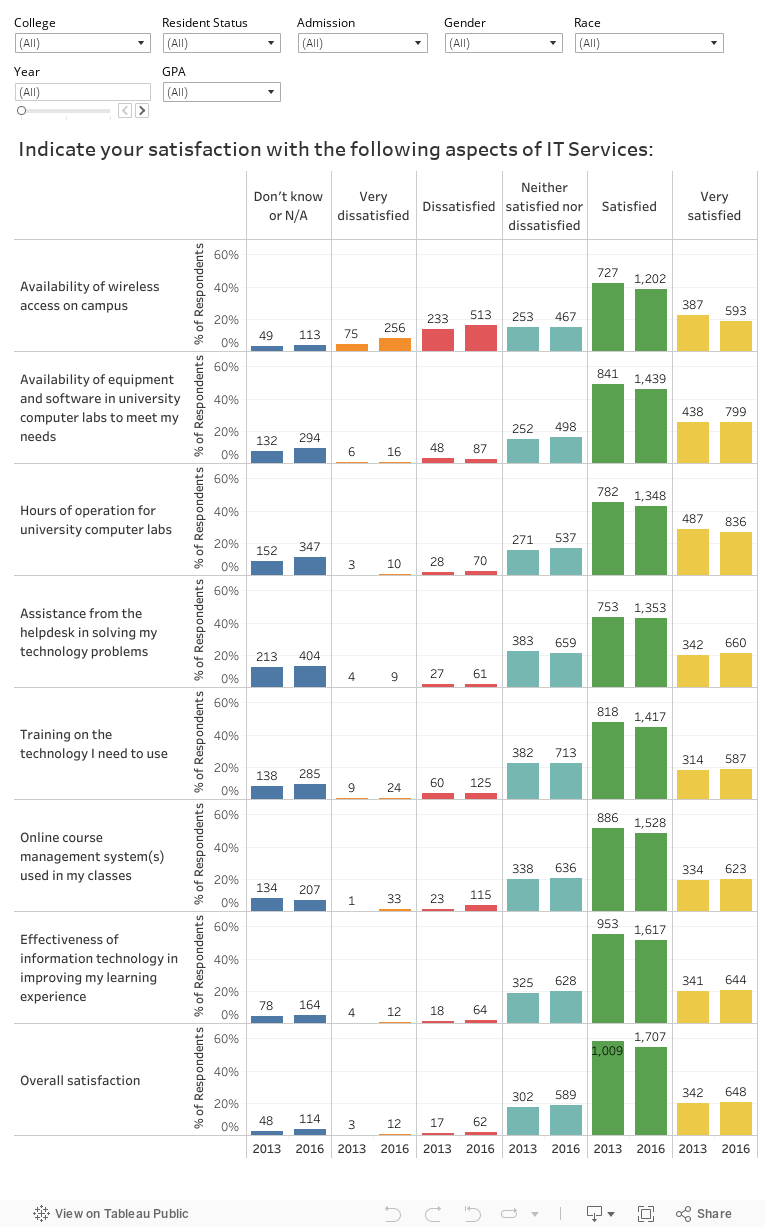
The dashboards below explore seniors’ satisfaction with various aspects of Information Technology Services on campus. The vertical bars represent the percent of question respondents that endorsed a given option, broken down by survey year. The numbers above each bar are the raw count of respondents. Use the dropdown menus to explore the data in further detail.
Return to main Senior Survey page.